
Analysis of the Effect
of Leaf Rust in Jeju
using Satellite-Based
NDVI Index
Team Korea Final Presentation
By Juyeon, Freesia, Ashley, Cathy, Jimin,
Jungseo
2

Introduction
01
On what Leaf Rust is and the reason to
why we are investigating its effect to the
subalpine zone of Halla mountain.
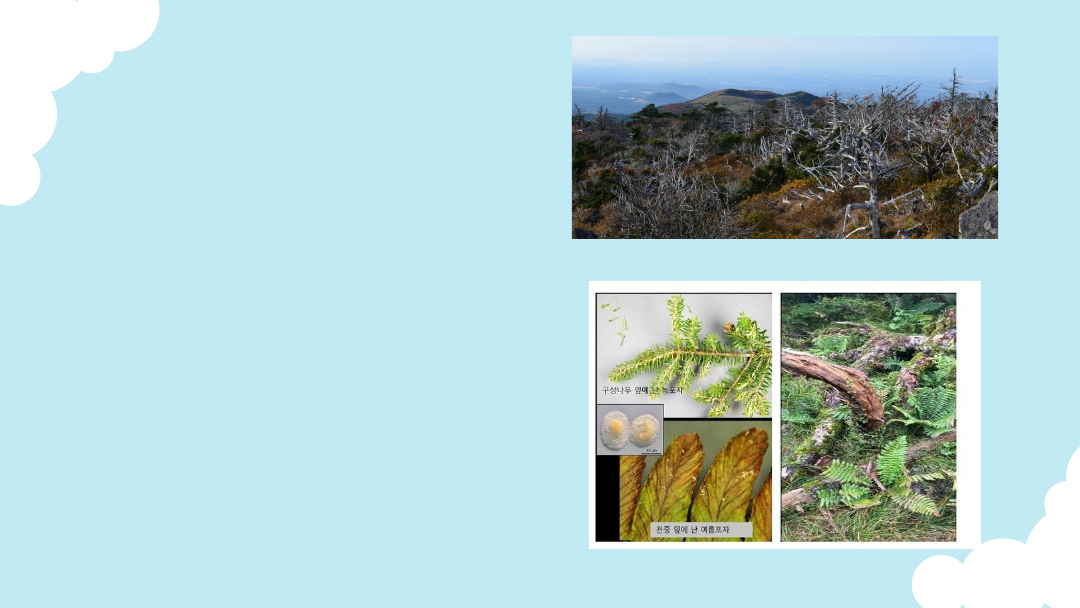
Leaf Rust
Spore-producing structures pustules
commonly found on the lower leaf surface
which severely affected leaves that often
turn yellow and fall prematurely.
Symptom and sign of leaf rust
on Korean Fir leaves
Shield Ferns living in the native
fir trees
Photos of Leaf Rust on Korean Firs
Why are we Investigating this?
●
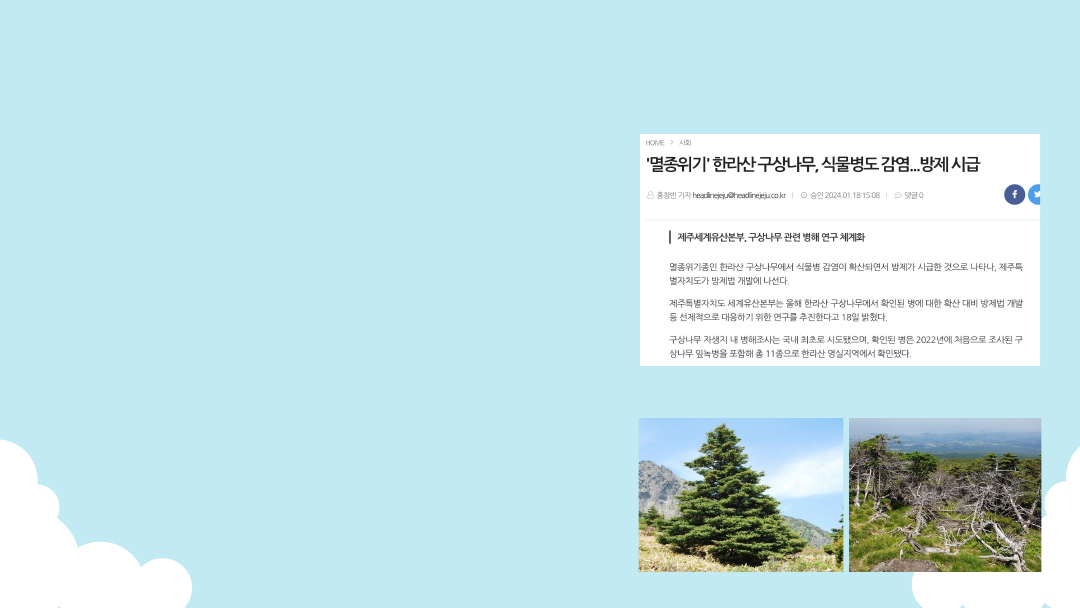
The Korean fir, listed as an endangered species
(2010) by the IUCN experienced significant
number of deaths since 2017 to 2021 onwards
●
Total number of deaths: 12,957
●
Change in vegetation cover area: 638ha to
606ha
●
Reason for death: weakened by the various
natural disasters (i.e. typhoon, drought, extreme
temperatures and weathers) brought on by
climate change, they are strongly affected by
the secondary attack by various pathogens of
plant disease
→ main reasons to explore in the project are
rain and extreme temperature fluctuations
Korean Fir (Abies koreana) - Leaf Rust, Phomopsis Canker,
Chestnut Blight
Image Source (from above, left to right): Headline Jeju, '멸종위기' 한라산 구상나무, 식물병도 감염...방제 시급, 2024 / Naver Blog 동지 #3 구상나무 / 한국일보, 한라산 대표 생물종 '구상나무' 최근 4년간 1만그루 넘게 고사, 2022

Time period of Investigation
→ 2019~2023 June/August
●
63% of plant deaths occur between spring and
summer
●
Plant diseases affected vegetation in Halla
Mountain from year 2017 ~ 2021, but because
GK2A didn’t operate in 2017~2018, limited time
scope
●
NDVI analysed by 1 week period in order to see
a clearer change in vegetation cover area
Image Source: [보도자료] 지리산 구상나무 집단 고사 지도 작성, 기후위기로 인한 집단고사 가속화 확인 돼, 녹색연합 “구상나무 고사 진행 빨라···멸종위기종 등재 서둘러야”
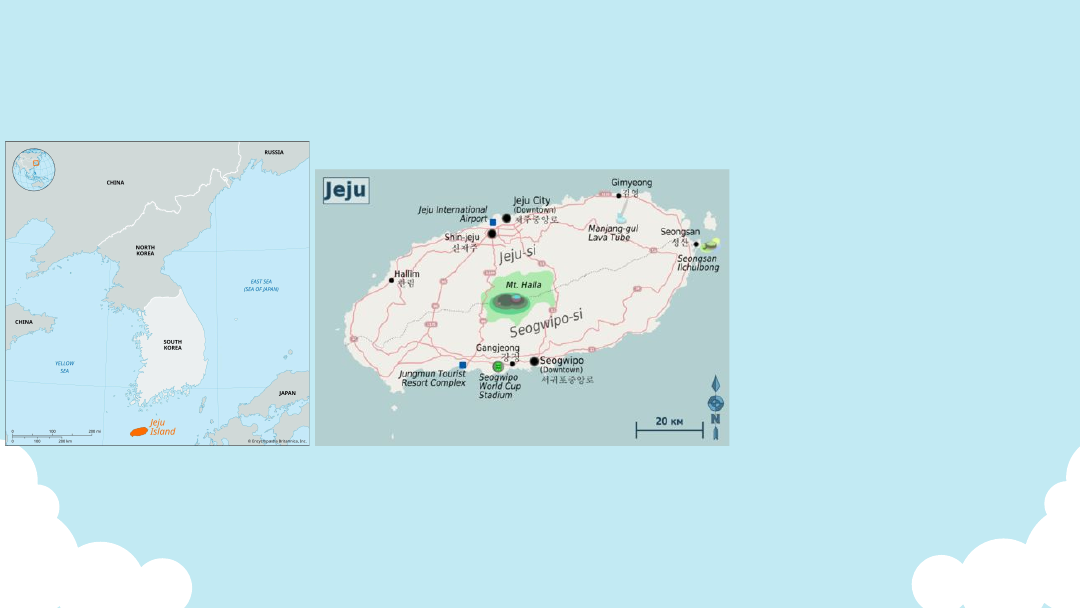
Place being investigated
Between two cities in Jeju
(Seogwipo city and Jeju City),
we chose Seogwipo city as
the place to investigate as
our school is located in
Seogwipo city, more
specifically on the area of the
subalpine zone of the Halla
mountain, the main and
tallest mountain of the Jeju
Island.

Method
02
What factors did we investigate? What
satellite data did we use? What indicator
did we use to analyse this data?

Our First Selection for Source
Korea Meteorological Administration Open MET Data
Portal
8
Features:
●
Open data portal to public including their
analysed data of ..
●
The number of rainy days
●
The number of snow days
●
The number of heat wave days / cold
wave days
●
The number of tropical days
9
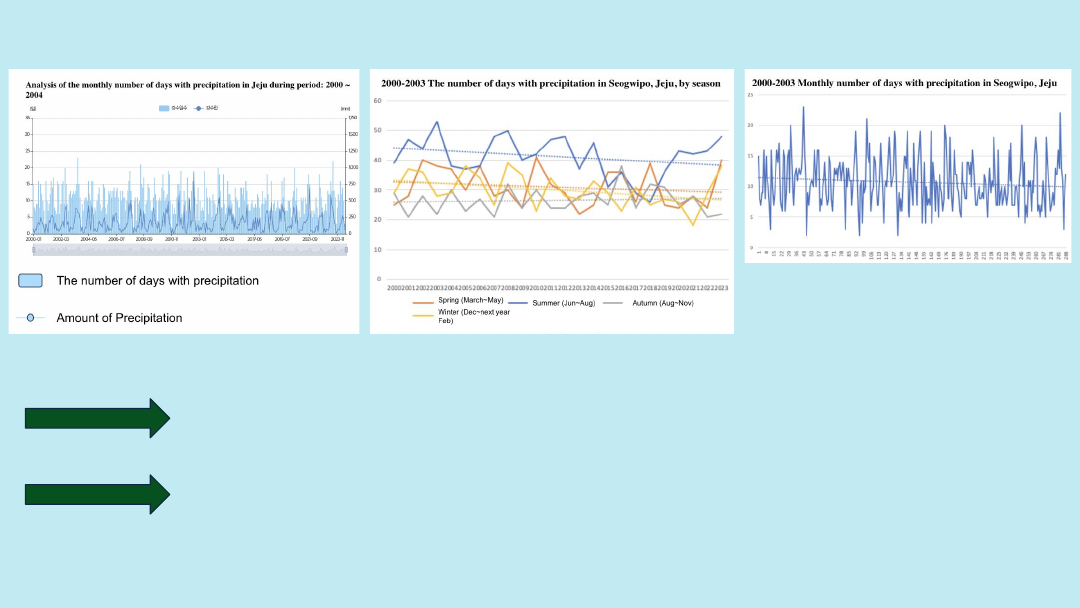
1. Number of Days with Precipitation
With the exception of autumn, the trend of seasonal precipitation days is
decreasing
The trend of monthly precipitation days is also decreasing
10
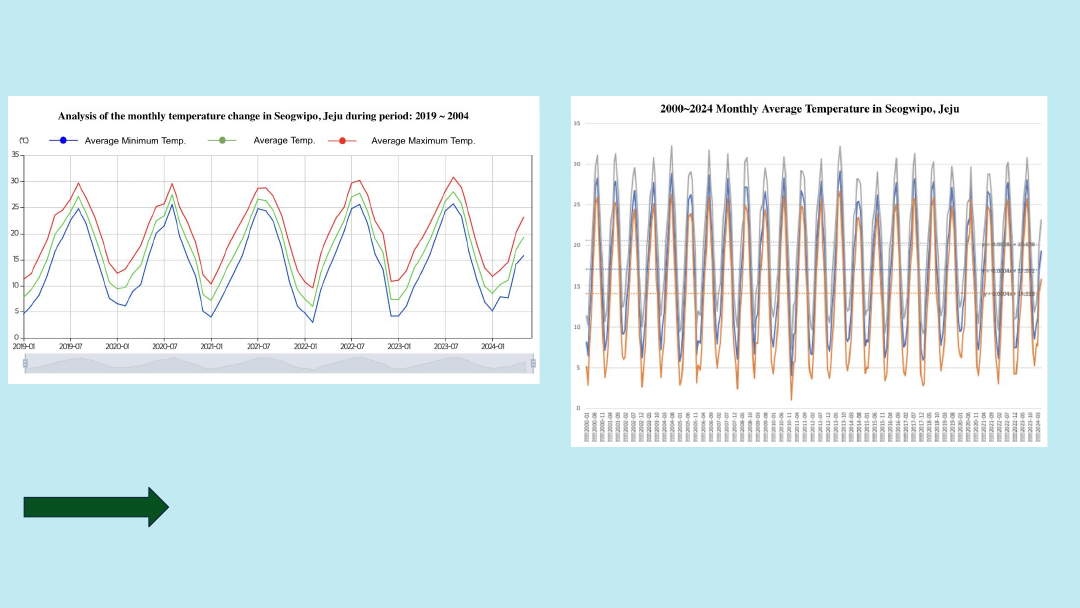
2. Monthly Temperature Change
The monthly average temperature change doesn’t show significant increase
or decrease
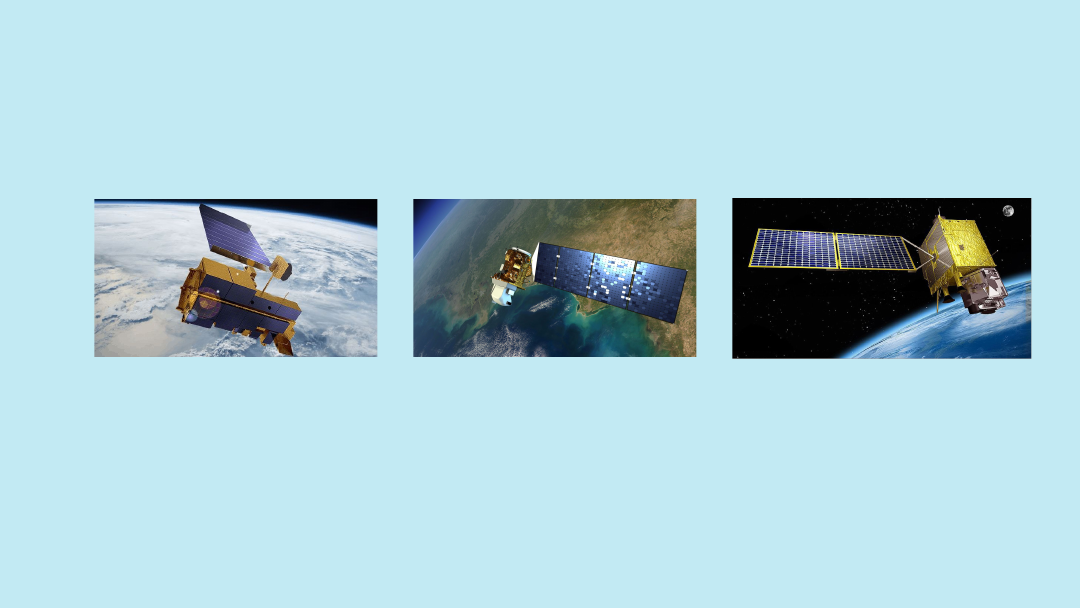
Satellites Used
NASA - Aqua MODIS
Orbital period: 98.8 minutes
Temporal resolution: Twice a day
Spatial resolution: 250m resolution
Launched in 2002,
20 years of continuous data
Landsat 9
Orbital period: 99 minutes
Temporal resolution: 16 days
Spatial resolution: 30m
Launched in 2021 September,
mission lasts 15 years
GK2A
Orbital period: 24 hours
Temporal resolution: 10 minutes
Spatial resolution: 2 km
Launched in 2018 September,
mission lasts 10 years
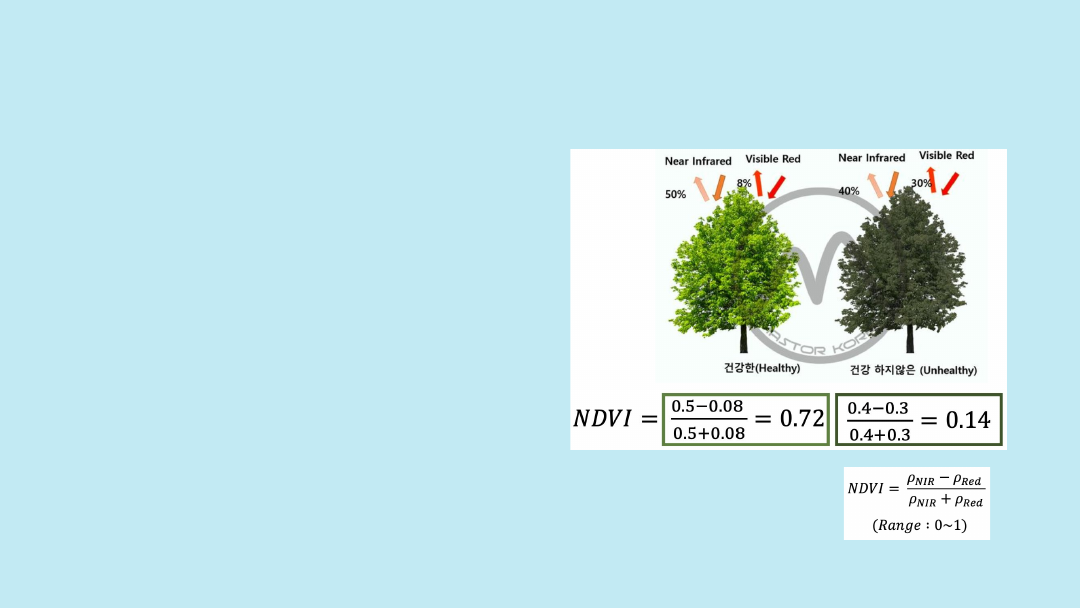
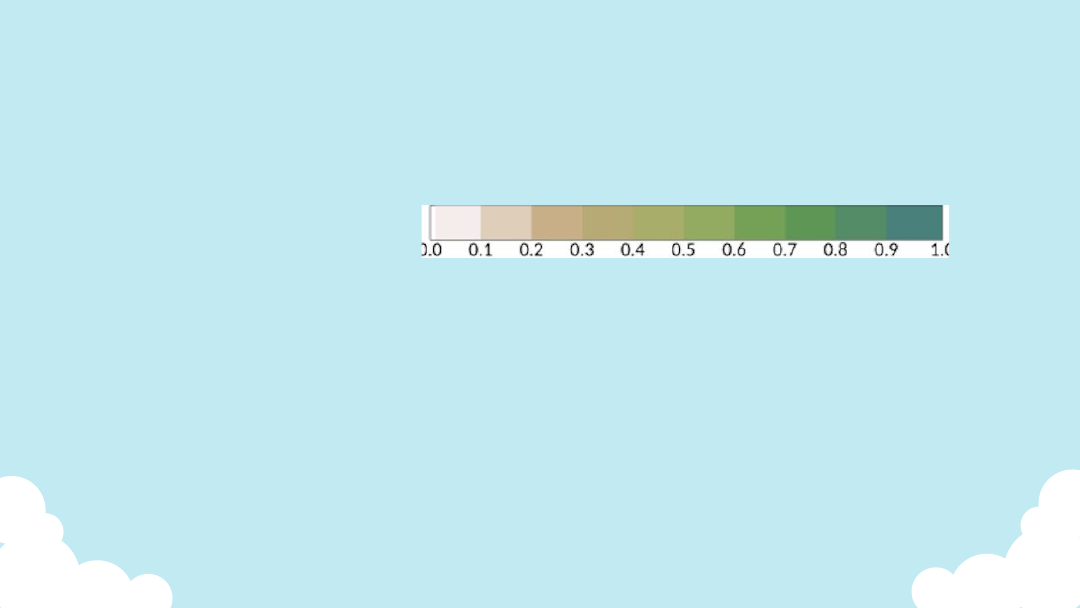
NDVI
●
Normalized Difference Vegetation Index
●
Satellite-based tool used to assess plant
health
●
Spectral index calculated from satellite
image data of red visible light and
near-infrared light (NIR)
●
Shows vegetation vs non-vegetation,
vegetation type, leaf area, and cover rate
*Value closer to
1 = healthier
plant

Analysis
03
On the satellite data collected and our
analysis on the results
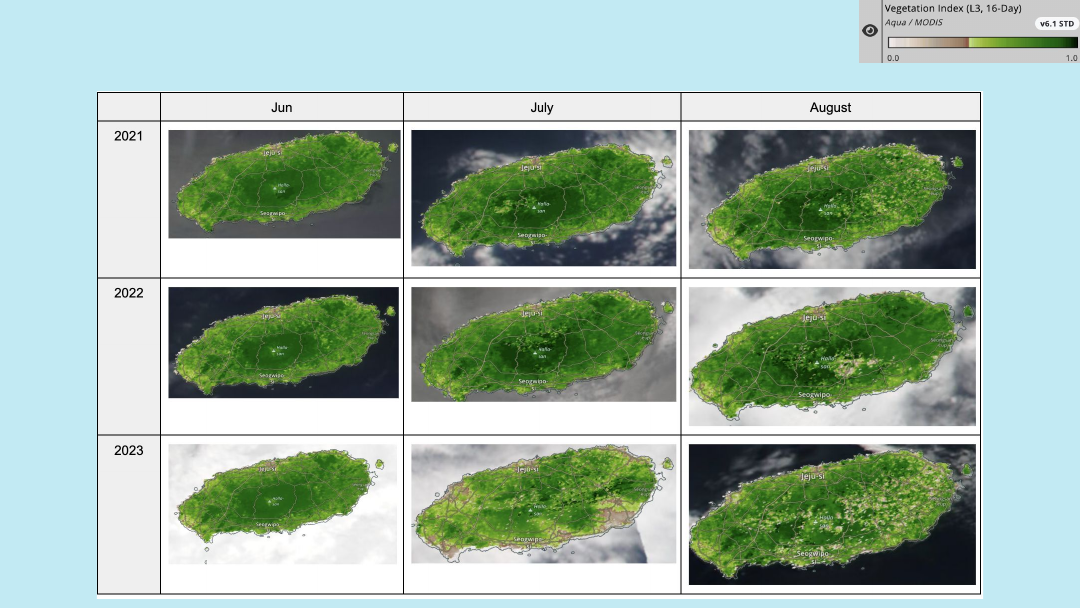
1. NASA Aqua MODIS
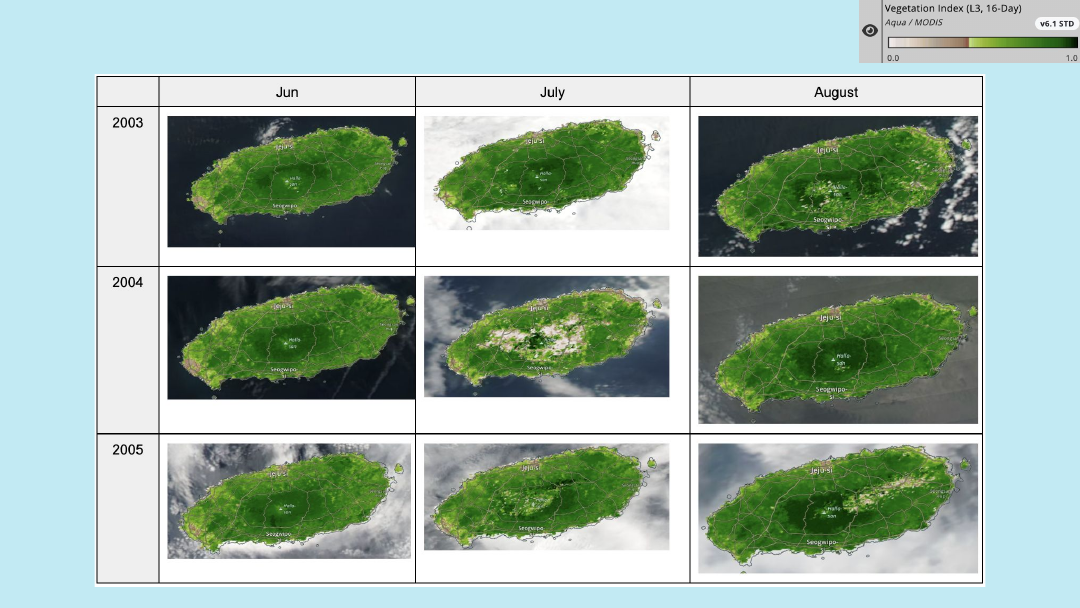

Analysis
●
Decided to take images of past and most recent data to make comparisons
○
Summer season
○
Past (2003~2005)
○
Recent (2021~2023)
●
Lowest NDVI values near Mt. Halla during 2004 July → potentially reflecting the
limitations of the model (contradicts what was written on the News)
●
Second lowest NDVI values near Mt.Halla during 2023 August
●
Highest NDVI values near Mt.Halla during 2005 August
●
Overall no huge difference in NDVI values on Jeju island between summer in the
past and present.
16

Evaluation of NASA Aqua MODIS Imagery
●
High spatial resolution images were taken
●
Still, there were limitations:
○
Cloud coverage - obstructing satellite view resulting in missing or inaccurate NDVI
values
○
Low time resolution / Infrequent updates - not good for short-term data
collection
■
Although indicated to have temporal resolution of twice a day, the worldview
site didn’t display updated data representations for some dates
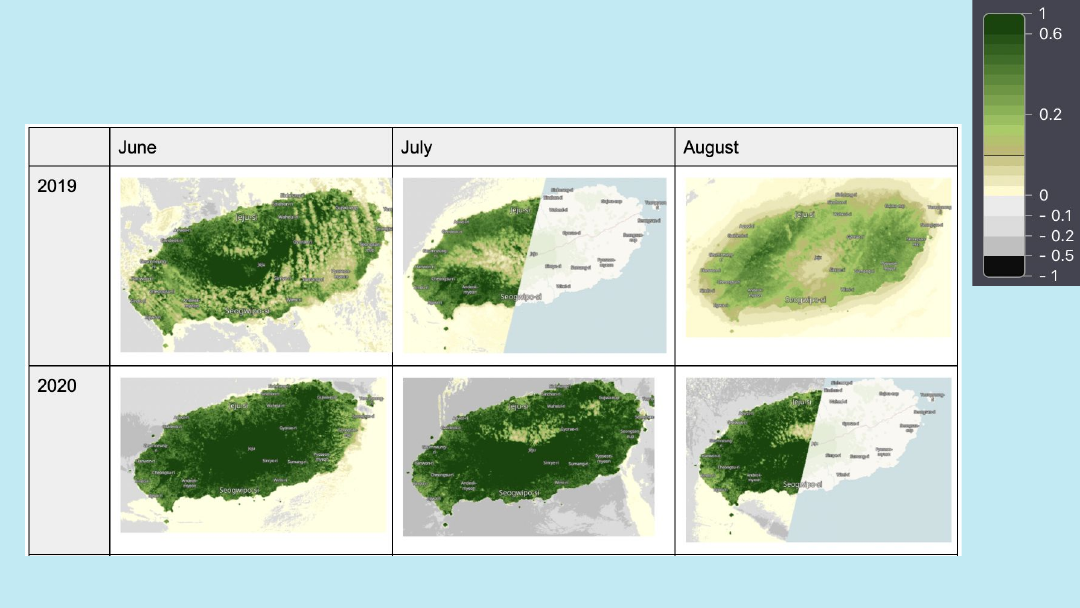
2. USGS/NASA - Landsat 9
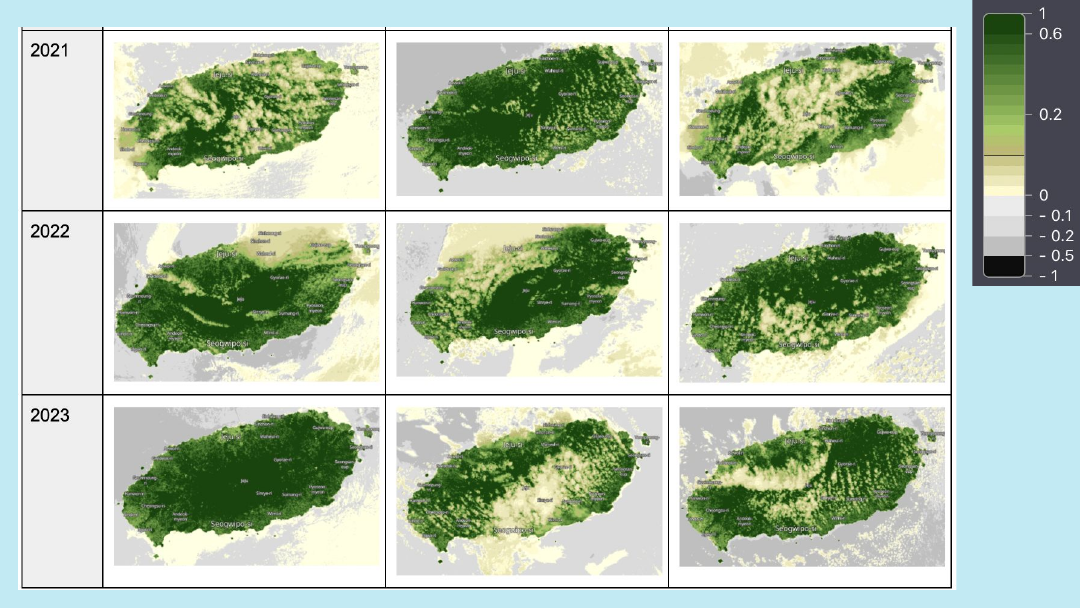

Analysis
●
Decided to take images from 2019 to 2023 to make comparisons in NDVI
○
Summer season (June, July, August)
●
Lowest NDVI values near Mt. Halla during 2019 August → considering the
limitations of Landsat imagery (cloud coverage)
●
Second lowest NDVI values near Mt.Halla during 2021 August
●
Highest NDVI values near Mt.Halla during 2023 June
●
Overall: Difficult to observe significant changes and patterns of each
month in NDVI values in the summer seasons of 2019 to 2023

Evaluation of Landsat Imagery
●
High resolution images were taken
●
Still, there were limitations:
○
Low Temporal Resolution: 16 days of revisit time
■
Relatively long interval
■
Difficult to monitor landsat images of a desired date (inadequate for short-term data observation)
○
Cloud Cover: Obstruction by clouds
■
The optical sensors of Landsat Satellite can’t penetrate the clouds
■
Results in significant data gaps → Limits data usage / difficult to analyse
○
Frequent Typhoons during summer season
■
Impossible to measure NDVI when precipitation is too high (which also increases cloud coverage)
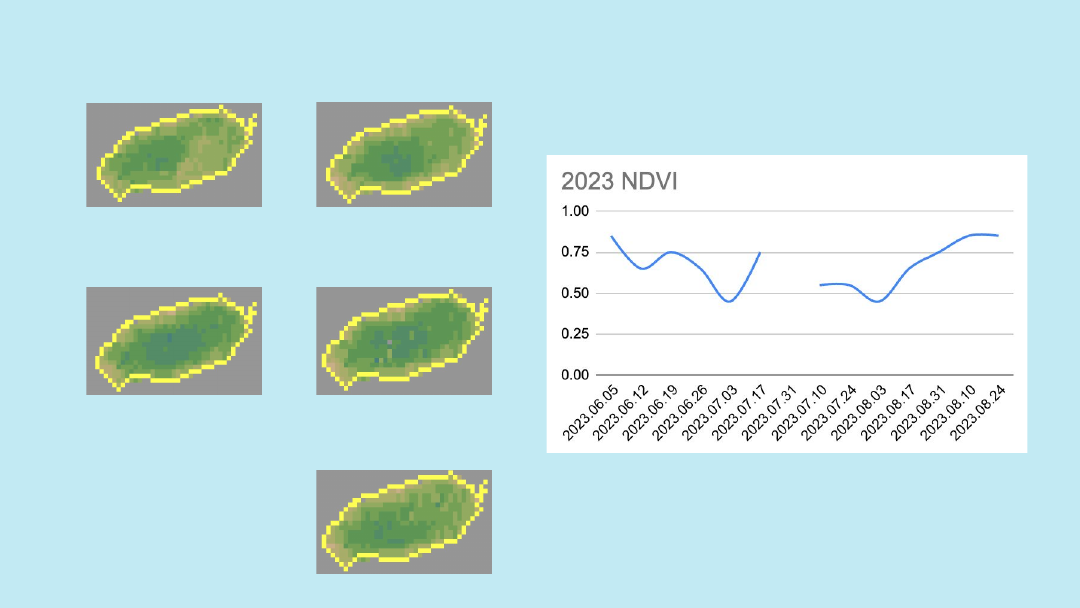
GK2A - Method Used for Calculation
●
Used color picker to discern specific colors in the satellite image, then compared
to key for NDVI values
●
Approximate NDVI value was calculated (with middle value between NDVI range,
ex. If value of colour between 0.0 and 0.1, value approximated to 0.05) to create
smooth line graph to depict the change in vegetation area
→
Why did we approximate the values?
GK2A image is pixelated (low resolution), so exact value cannot be discerned
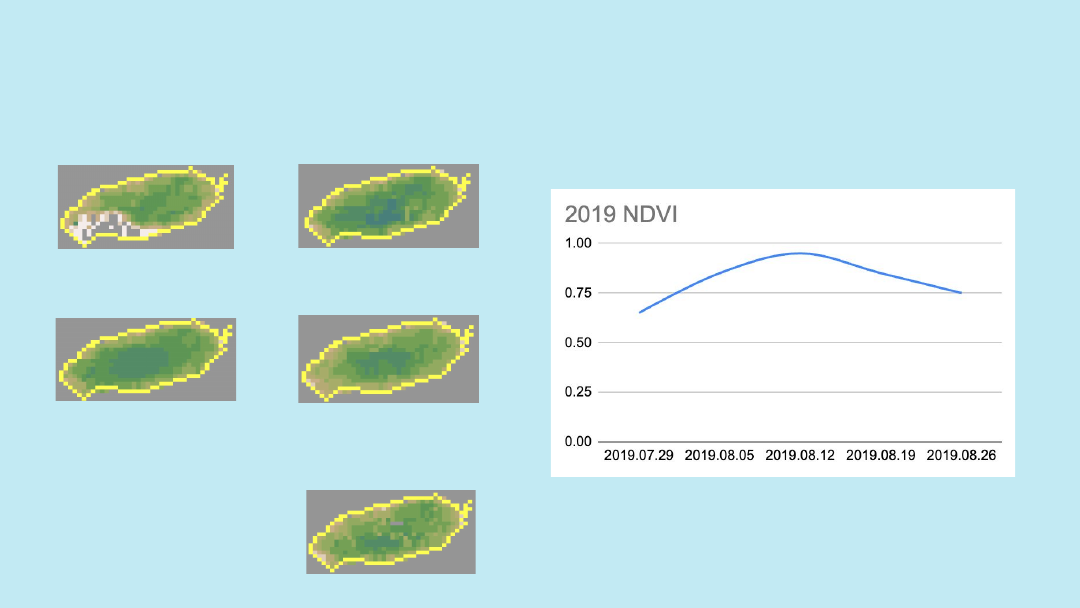
2019.7.29
2019.8.5
2019.8.12
(all images from 9:00am KST & 0:00 UDT )
2019.8.19
2019.8.26
< 2019 >
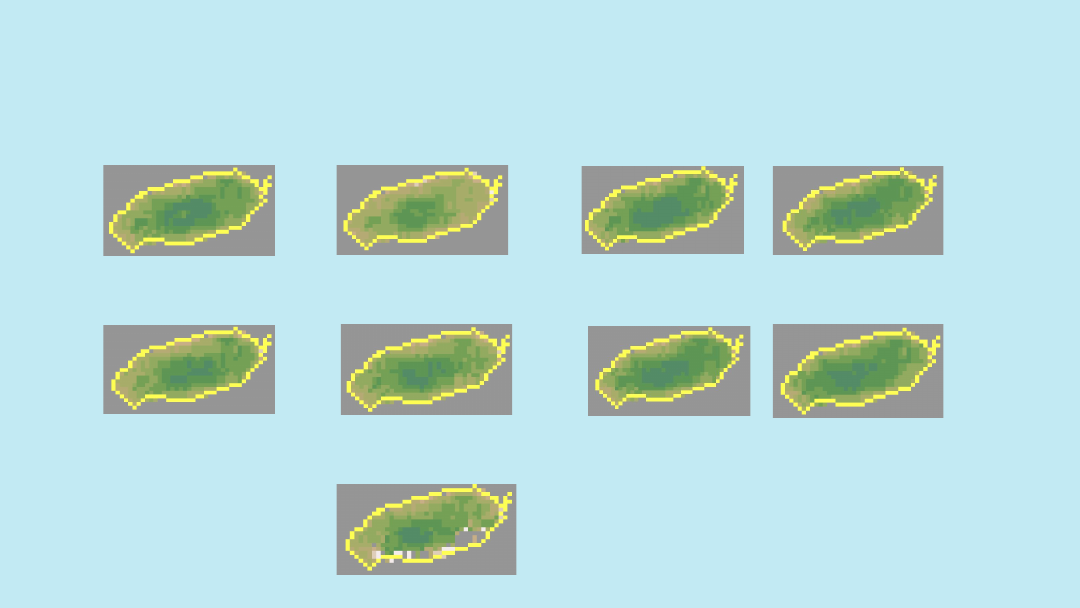
2020.06.01
2020.06.08
2020.06.15
2020.06.22
2020.06.29
< 2020 >
2020.07.06
2020.07.13
2020.07.20
2020.07.27
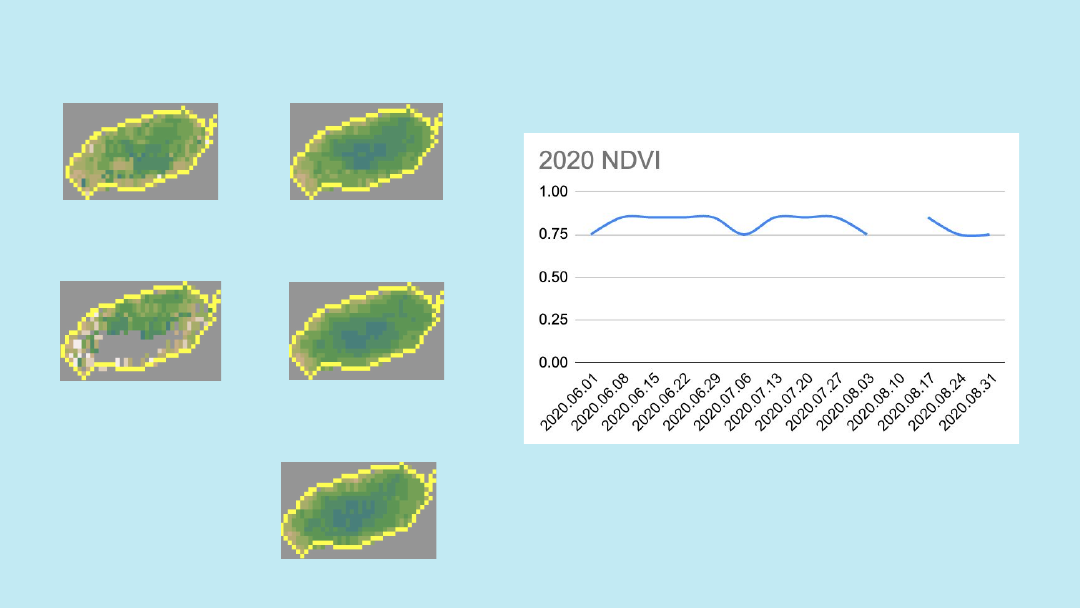
2020.08.03
2020.08.10
2020.08.17
2020.08.24
2020.08.31
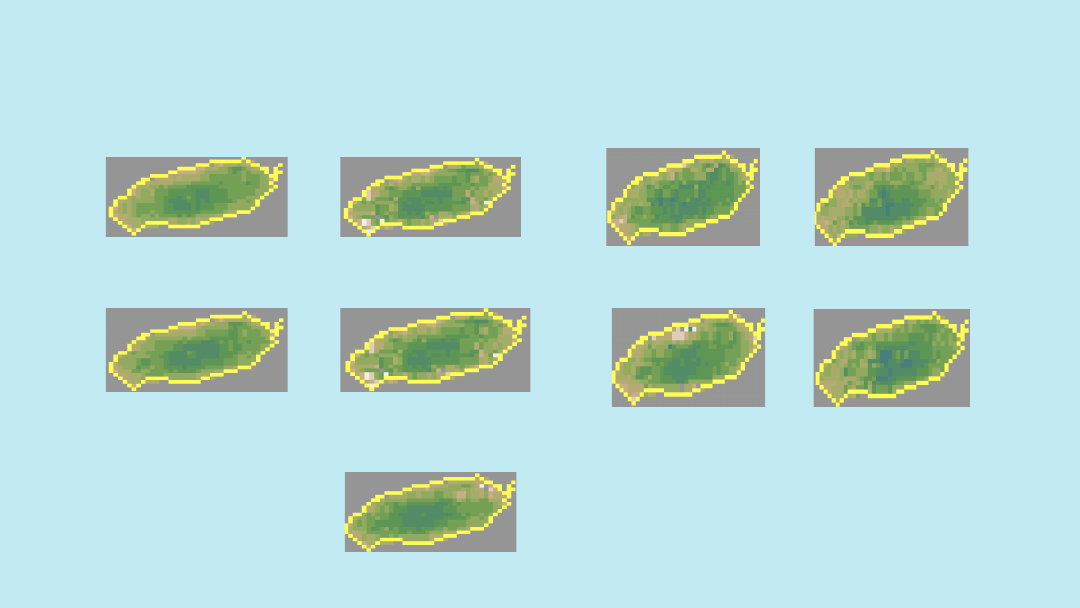
< 2021 >
2021.06.01
2021.06.08
2021.06.15
2021.06.22
2021.06.29
2021.07.06
2021.07.13
2021.07.20
2021.07.27
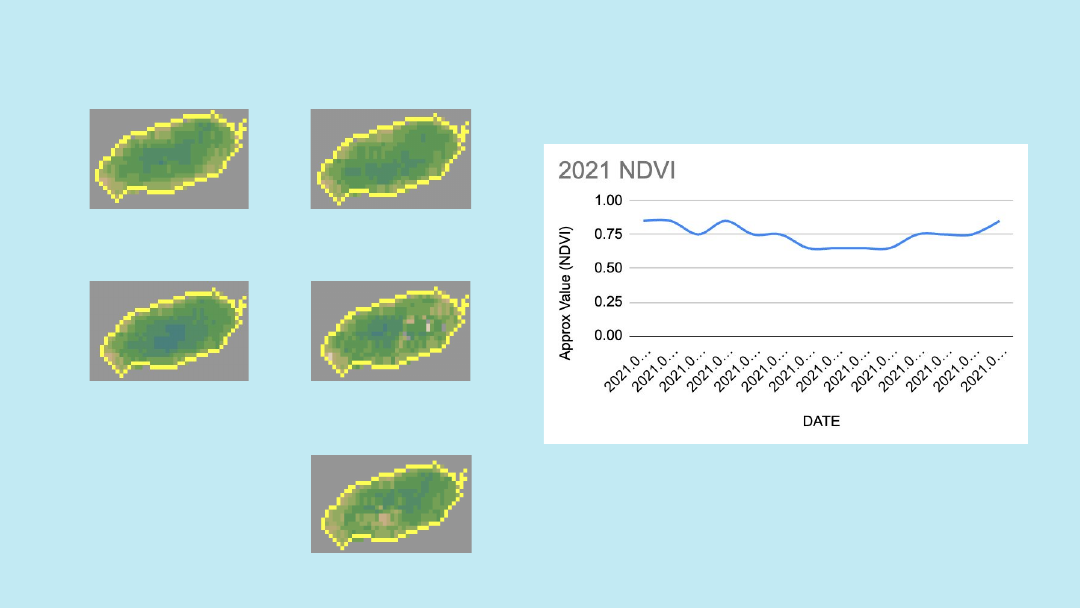
2021.08.03
2021.08.10
2021.08.17
2021.08.24
2021.08.31
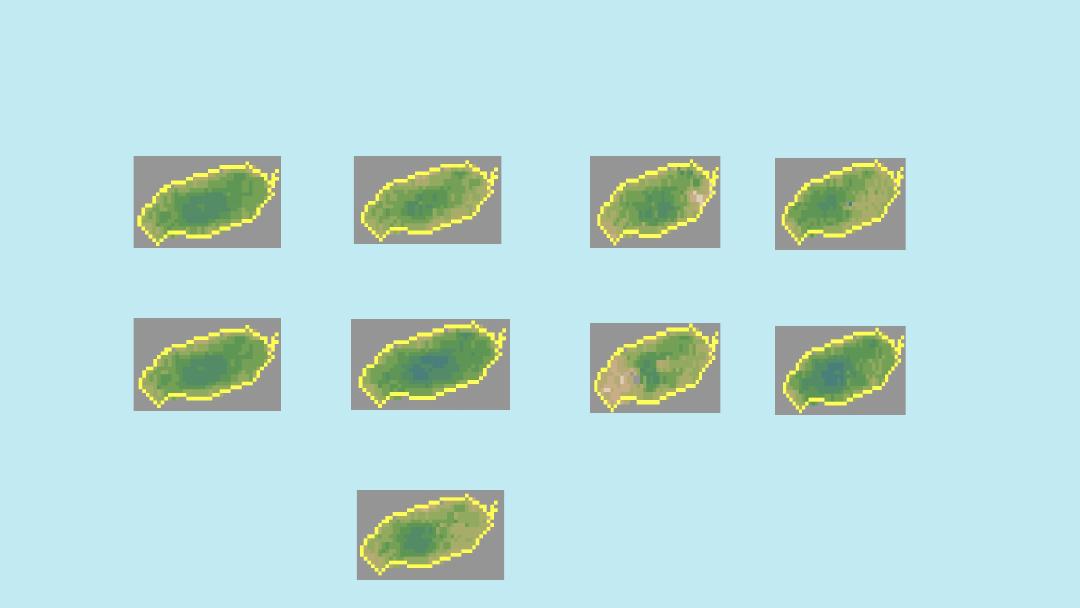
< 2022 >
2022.06.01
2022.06.08
2022.06.15
2022.06.22
2022.06.29
2022.07.06
2022.07.13
2022.07.20
2022.07.27
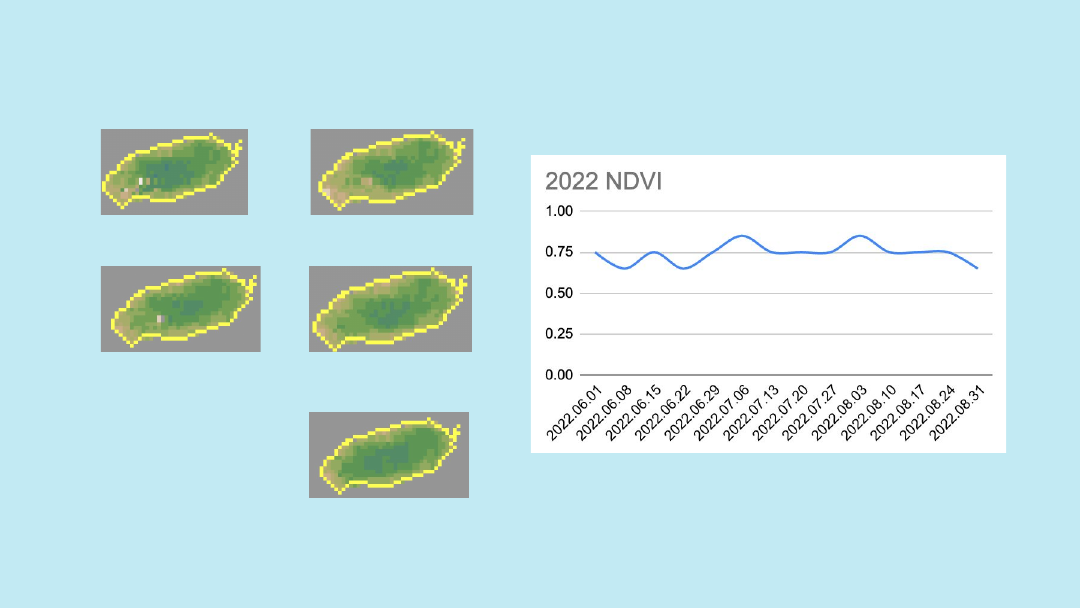
2022.08.03
2022.08.10
2022.08.17
2022.08.24
2022.08.31
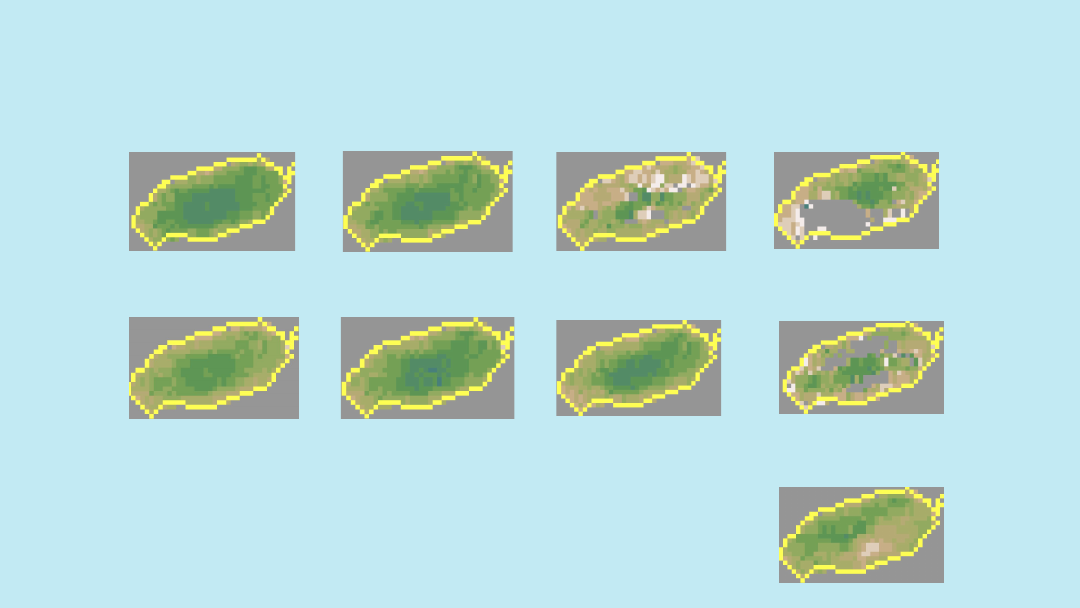
< 2023 >
2023.06.05
2023.06.12
2023.06.19
2023.06.26
2023.07.03
2023.07.10
2023.07.17
2023.07.24
2023.07.31
2023.08.03
2023.08.10
2023.08.17
2023.08.24
2023.08.31
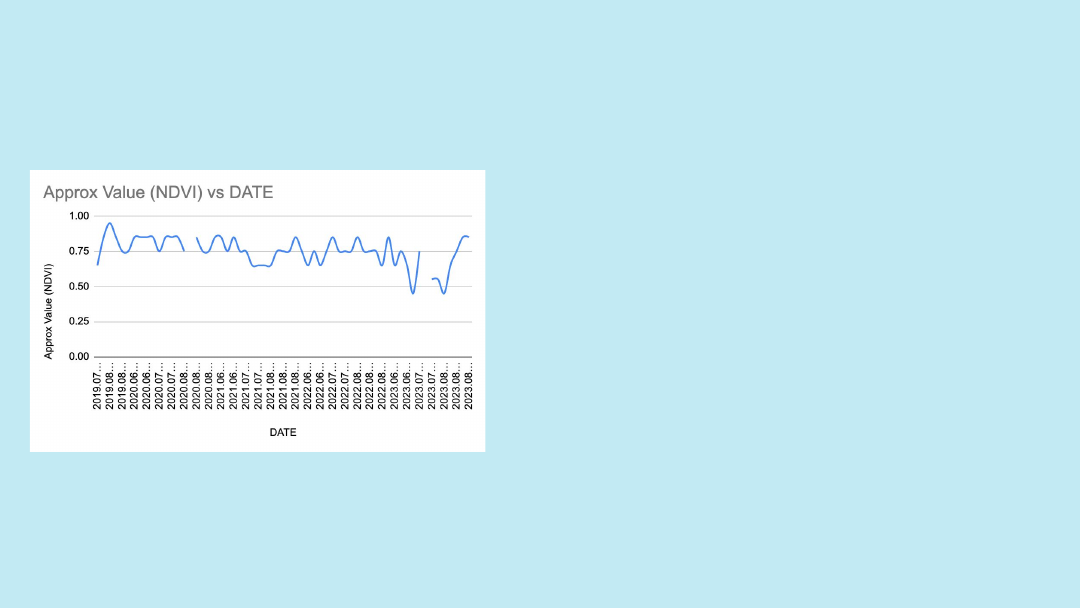
Analysis
●
Decided to take images from 2019 to 2023 to make
comparisons in NDVI
○
Summer season (June, July, August)
●
Able to observe a trend where the average value of
NDVI is descending overtime
○
Highest NDVI in 2019 August
○
Lowest NDVI in 2023 June & August
●
More fluctuating pattern of NDVI value is observable
in 2023
●
Overall: Difficult to observe clear patterns in the
fluctuation of NDVI values and has contrasting
patterns with data observed from other satellites

Limitations of GK2A Imagery
●
Despite the precision and strong reliability of the data updated every 2 minutes, there were some
limitations to the data collected from GK2A:
○
Low Spatial Resolution: 2km
■
Very low compared to the spatial resolution of 250m(Aqua MODIS) and 30m (Landsat 9)
■
Unable to analyse the specific locations and identify the Halla mountain as accurately as the
other satellites, bringing limitations to the collected data and its analysis
○
Cloud Cover: Obstruction by clouds
■
Led to some gaps in the data of some regions of the island
○
Limit of Availability: Launched in 2018, with data available from July 2019
■
Unable to collect NDVI data from the GK2A prior to July 2019, leading to limitations of the
analysis of the overall trend

Conclusion
04
Conclusion we drew from the analysis
and evaluation of the method used

The three different satellites that we chose to use for the investigation showed incongruous results:
●
NASA Aqua MODIS
○
Lowest NDVI in 2004 July, 2003 August
○
Highest NDVI in 2005 August
●
Landsat 9
○
Lowest NDVI in 2019 August, 2021 August
○
Highest NDVI in 2023 June
●
GK2A
○
Lowest NDVI in 2023 June/July
○
Highest NDVI in 2019 August
Although we couldn’t conclude that the effect of leaf rust on Mt. Halla was the biggest factor contributing to changes of
NDVI in the subalpine zone on Jeju Island, we have learned that NDVI fluctuates more frequently than we expected during
summer season in Jeju.
We think this was due to several reasons:
●
Each satellite’s potential limitations affecting the data
●
Jeju’s extreme weather during the summer which overlaps with the period of investigation
○
E.g. Frequent typhoons in summer affecting Landsat 9 Imagery
○
E.g. Frequent monsoon seasons
●
Jeju island is too small that satellites cannot show nuanced changes of NDVI in the subalpine zone around Mt. Halla /
Seogwipo area
Conclusion

CREDITS: This presentation template was created by Slidesgo, and
includes icons by Flaticon, and infographics & images by Freepik
Thank you!
